What I Learned Running 100K+ Concurrent AI Agents
Numerous agent blogs ive read so far stay on harness engineering (tools, prompts, orchestration, memory, etc.), which is awesome and super interesting. However, this one is more about the boring layer around the model calls, the databases, pools, queues, and HTTP paths that still have to work when you leave the demo and run under real load.
The uncomfortable truth
You ship a “working” agent, and the story usually rhymes like this.
- Demo: one user, one agent; silky smooth.
- Staging: a handful of users, some timeouts, still manageable.
- Production: serious fan-out, and suddenly it feels like a different product entirely.
Same prompts, same tools, same business logic, but now you’re out of DB connections, your HTTP pools are starved, rate limits light up, retries stack into a thundering herd, and the whole thing eats itself. The agent logic didn’t change; what changed is everything around the model calls.
Under real scale the work shifts toward infrastructure, not cleverer prompts in isolation. OpenAI serves ChatGPT to 800M weekly users on a single-primary PostgreSQL fronting millions of QPS across ~50 read replicas. Stripe defends its payments API with a four-layer rate limiter that rejects millions of misbehaving requests a month, the same pattern you need around an LLM provider key. Discord scaled 5M+ concurrent WebSocket connections on Elixir/BEAM, a different runtime expressing the same lesson your Python async stack relies on: cheap concurrent units, not threads, are how you fan out across thousands of network calls. The common thread is a production toolkit you would not skip on any critical path: queues, pools, backoff, rate budgets, and observability. Treat agent infrastructure with the same rigor as any other production system.
Why async actually buys you concurrency
async multiplexes many paused I/O waits on one thread but it does not hide blocking calls or long CPU work on that same
thread. Under load that distinction is what decides whether your loop keeps moving.
Python’s event loop is basically a single-threaded scheduler built from a ready queue of callbacks, an OS-level I/O multiplexer
that tells you which sockets woke up, and a time-sorted heap for “run this later”. It loops forever, draining ready work,
asking the OS what is readable or writable, then scheduling the next callbacks.
When a coroutine hits await, it doesn’t park a thread; it registers interest with the kernel and yields
control back to the loop. That is why a single process can have tens of thousands of in-flight LLM calls. Each one is
a cheap coroutine waiting on network I/O, not an 8MB stack thread doing nothing.
await, it yields so other coroutines can run. That’s why one process can park thousands of in-flight LLM calls without thousands of threads.The gotcha is almost boring, but costly. Blocking work still blocks the loop. Because everything shares one thread, any stretch of synchronous I/O or non-yielding work can freeze the whole scheduler. We’ve run into production incidents where sync HTTP clients sat inside async handlers, blocking database drivers held the loop, or code waited synchronously instead of yielding so other work could run.
Common traps in agent-shaped code include the following.
- Synchronous HTTP clients inside async functions
- Synchronous database drivers
- CPU-heavy JSON parsing on massive model responses
- File I/O without async wrappers
The rule stays simple. In an async context, I/O should yield. If it doesn’t, the “100k concurrent agents” story collapses into one thing at a time.
HTTP under real load
Every LLM call is just HTTP with extra vibes. At scale, timeouts, resets, 429s, and flaky 5xxs are not edge cases; they happen all the time. You want pooling, layered timeouts, retries that don't make things worse, and a circuit breaker so you’re not hammering a dead endpoint on principle.
Opening a new connection repeats DNS lookup, the TCP handshake, and TLS negotiation. That setup alone routinely costs tens to a few hundred milliseconds before you send application data on a connection you have not reused yet. Stack thousands of those setups and you burn minutes on overhead alone. Pooling amortizes that setup across many requests and the critical alignment detail is matching your pool's per-host connection limit to whatever concurrency cap you think you're enforcing with semaphores. If fifty coroutines can hit the LLM but the pool only owns ten sockets, forty of them are just waiting on each other.
Different failures deserve different clocks. Layer them so each is tighter than the next: connect ≤ TTFT ≤ inter-chunk ≤ total. Connect timeouts should fail fast on a dead route, but not so tight that they false-positive on a normal TLS handshake. TTFT (time-to-first-token) covers “request accepted, model has not produced a token yet” and needs to absorb provider queueing and reasoning that model warm-up without cutting off legitimate slow starts. Inter-chunk read timeouts need slack so tool-calling and reasoning pauses inside an otherwise valid stream don’t look like a stall. In practice, timestamp each chunk and fail the stream early if the gap exceeds a per-chunk ceiling, which catches “accepted, started, then dropped mid-generation” failures faster than a wall-clock total alone. The total cap is the hard backstop, sized from product UX rather than a stock default. Anything that wants to run beyond your product’s tolerance belongs in a durable workflow, not one HTTP call.
Retries only work if you classify errors first. Permanent failures (400, 401, 403, 404) should not loop because the request is wrong or
unauthorized. Rate limits (429) need retries that respect Retry-After, not blind hammering. Server
overload (502/503/504) needs exponential backoff so you aren’t pile-driving an already sick dependency. Transient blips
(resets, timeouts) get the usual backoff, plus jitter, because synchronized retries are how a thousand
agents become a thundering herd.
Circuit breakers are the production version of “stop calling this for a bit.” When a dependency's error rate crosses a threshold, the breaker opens and fails fast locally instead of wasting slots on an endpoint that is already unhealthy. After a cooldown, it moves to half-open and lets a small amount of probe traffic through. If the probes succeed, it closes again. If they keep failing, it opens again. Scope breakers per dependency, provider, model, or region so one flapping endpoint does not disable the fallbacks meant to save you.
PostgreSQL: the part people undertune
There is a reason the "just use Postgres" meme has stayed popular :). A well-tuned PostgreSQL instance can carry far more load than we can expect, and its feature set covers enough ground that adding extra moving parts is rarely the first answer. Every extra hop is another network round-trip, another on-call surface, and another place consistency can quietly drift from the source of truth. Add a moving part when measurements demand it, not before.
MVCC with dead tuples
PostgreSQL keeps old row versions in place for MVCC. Every UPDATE writes a new tuple and marks the previous one
dead, and DELETE marks tuples dead. Those dead versions stick around until vacuum reclaims them. I’ve seen
high-churn agent tables where dead tuples outnumbered live rows by an order of magnitude because autovacuum couldn’t keep up
with the write pattern.
Regular VACUUM marks dead space reusable inside the table without blocking normal reads the way a rewrite would.
VACUUM FULL reclaims space to the OS, but takes an exclusive lock, so treat it as a controlled maintenance hammer, not
as a background janitor. For high-churn tables, “defaults are fine” is a trap. Tune autovacuum to trigger at a few percent
dead tuples (not the stock ~20%), and give it enough budget to finish during business hours.
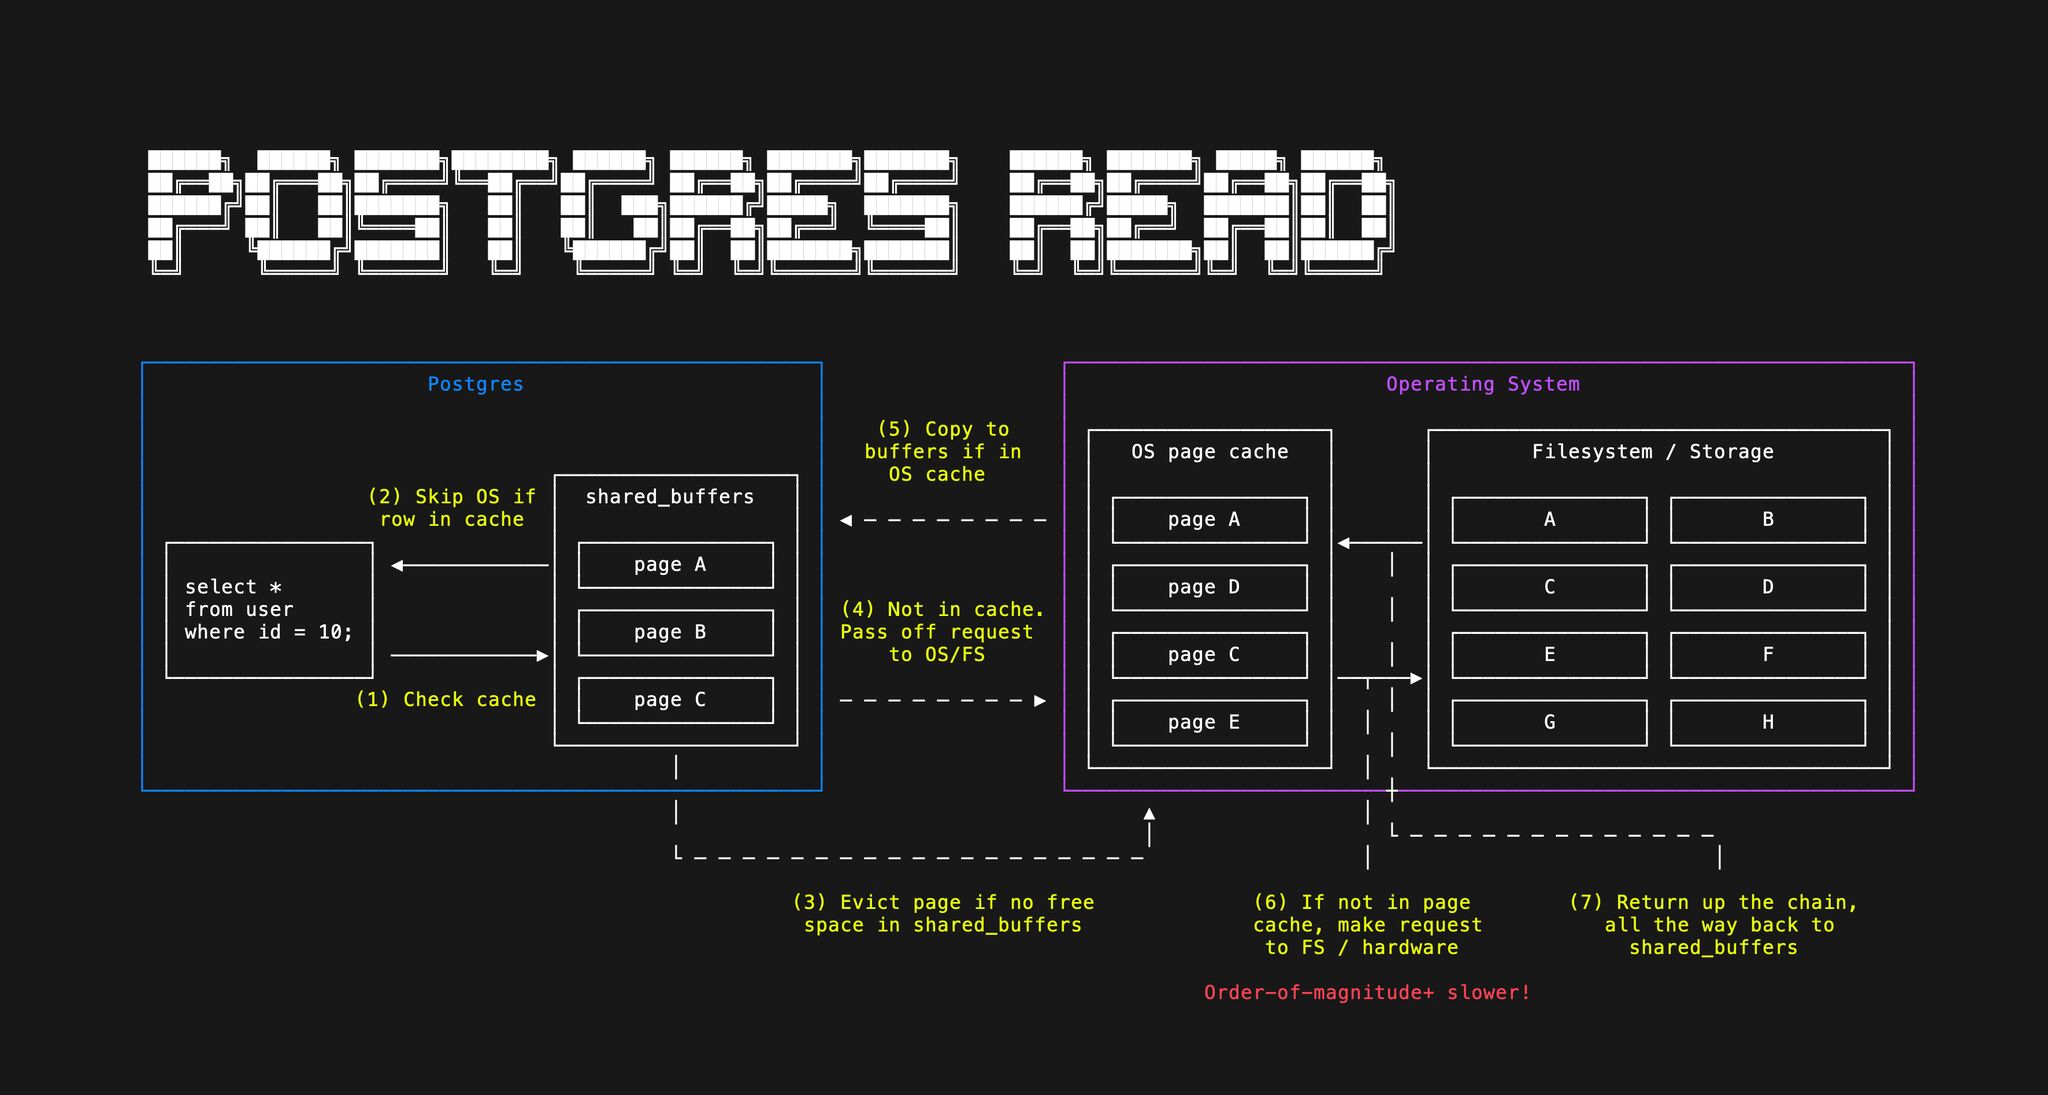
Reads stack in three layers, fastest first. Hits in Postgres shared_buffers are usually cheapest.
A miss may still be satisfied from the OS page cache, with no physical disk read, but Postgres still needs to
copy that page into shared_buffers. When both caches miss, you fall through to storage, which is
far slower. On a dedicated host, shared_buffers around a quarter of RAM is a common starting point so the kernel
still has room for page cache and filesystem work. In addition, Effective_cache_size is not allocated memory; it is a planner hint for how much cache Postgres can reasonably
expect across shared_buffers and the OS page cache, often somewhere around half to three quarters of RAM. In
production, watch buffer hit ratio, query plans, pool waits, lock waits, and p95/p99 latency. If those look healthy, many reads
are already coming from memory one way or another, which is the bar Redis has to beat. On read-heavy hosts, let spare RAM stay
useful as page cache instead of reflexively adding another cache tier.
PgBouncer and multiplexing
Postgres connections aren’t free. Each client connection maps to a dedicated backend process consuming memory and scheduler overhead, often on the order of megabytes. Stack hundreds of them and you
can spend gigabytes before doing useful work. Async apps love to spawn huge coroutine counts; if each coroutine expects its own live server connection, you’ll hit max_connections or
RAM, whichever comes first. PgBouncer, especially transaction pooling, multiplexes many client sessions onto a smaller pool of real Postgres backends. After each transaction, the server connection
goes back to the pool, which is exactly what bursty agent traffic wants.
App-side waiters: 0 · In flight on Postgres: 0/4 · Completed this session: 0
Read replicas: scaling beyond a single node
Read replicas help when reads dominate. The primary streams its write-ahead log; replicas apply changes in near real time. You get throughput and isolation. Heavy context reads on followers don’t compete with checkpoint writes on the leader. The downside is replication lag. Followers can lag by milliseconds to seconds. For most agent workloads, “read slightly stale context” is fine if you know what your product actually needs before you promise read-your-writes everywhere. If you want this managed instead of self-hosted Postgres, PlanetScale packages the same primary/replica idea. In practice, it has been some of the fastest Postgres I have seen so far!
Cleaning old state: partitioning vs. DELETE
Agent stacks accumulate time-bounded rows: sessions, checkpoints, tool traces, append-only events. On one wide heap, “older
than a cutoff” is usually DELETE FROM events WHERE created_at < $cutoff. Every removed row stays dead until
VACUUM can reuse space in that same relation. At millions of matches you pay WAL and write amplification during the
delete, then a long autovacuum tail; people live in n_dead_tup and disk charts for hours, often long after the
DELETE finishes.
Range partitioning by time makes each window (day, week, or month, depending on volume) its own child on disk. Retention is
ALTER TABLE … DETACH PARTITION … then DROP TABLE on the detached child, or a direct DROP TABLE
on the partition. You unlink that child’s files and update the catalog instead of scanning one giant
heap, so space tends to drop back at the filesystem and you skip the “delete then autovacuum forever” loop on the parent for that
slice. There is no big VACUUM over the retired data because those heap files are gone, not full of dead tuples for
autovacuum to chew. Autovacuum auto-analyzes each leaf partition you keep, but it does not refresh the parent’s inherited
statistics. After a detach or drop, those parent stats can go stale on min/max boundary values and mislead the planner, so run
ANALYZE on the parent yourself. Cheap, next to reclaiming gigabytes from one monolithic table.
DETACH / DROP is catalog work plus unlinking that child’s heap, so there is no heap
VACUUM pass over the retired slice. Autovacuum still matters on the partitions you keep.
Indexes: add them deliberately
Indexes are one of the highest-leverage tuning moves and also the easiest to overdo. EXPLAIN ANALYZE is the
first tool to reach for. Run it on your slow queries and check whether the planner is scanning when it should be seeking.
When a column appears in every hot WHERE filter or JOIN, an index is almost always worth adding.
The trap is write amplification: every index has to be maintained on every insert, update, and delete. On high-churn agent
tables, a handful of well-chosen indexes beats a dozen speculative ones. Index bloat is real too, and dead tuple versions
pile up inside index structures just like in the heap, so autovacuum has to keep up with both. Add indexes deliberately,
and revisit them when write latency starts creeping.
Redis: add it for a reason, not by reflex
Hot take, but I stand by it. Redis is another network hop, another cache invalidation story, and another on-call surface area. If Postgres is already hot in memory and returning what you need, "faster in isolation" isn't automatically faster end-to-end. Measure cache hit ratio and tail latency first. A lot of "we need Redis" is really "we haven't looked at indexes and pool sizing yet."
Redis earns its keep when you need something like the following.
- True sub-millisecond latency requirements Postgres can’t meet after honest tuning
- Specialized structures such as TTL-heavy rate limits, pub/sub, sorted sets
- Distributed locks across many app instances
- Ephemeral session state you can afford to lose on restart
For a lot of agent stacks, that list is shorter than people expect, which is good news if you like sleeping through the night.
Queues: Turn Spikes Into Backlog
The pattern is old. Without a queue, a traffic spike means your API tries to run a thousand agents at once, each holding DB slots, HTTP pool capacity, and RAM, and the stack falls over in a correlated splat. With a queue, submission decouples from execution, so spikes mostly grow backlog depth, which is a knob you can monitor, cap, and shed. Workers pull at a sustainable rate, and retries and dead-letter behavior live in the broker instead of half of SQS reimplemented in app code.
If depth is unbounded you eventually run out of memory or disk. The quieter failure is staleness: the worker reaches the job after the user has already timed out or given up. Backpressure is how you refuse to absorb endless demand: reject or slow enqueue past a depth threshold, shed low-priority work to protect the hot path, or return an explicit busy / retry-later so callers backoff instead of joining a minutes-long pipe. The right mix depends on the product; for user-facing agents, a fast “please try again” is often better than landing in a five-minute backlog.
Prefetch is your distributed semaphore. Ten unacked messages per worker across fifty workers is five hundred in-flight agent runs, regardless of how deep the queue is. Line that number up with provider rate limits and your PgBouncer pool on purpose. Pair it with queue-depth autoscaling and the system self-regulates. Backlog grows, replicas add (up to a cap), work drains, replicas ease off.
Queue depth: 0 · In flight: 0/16 (4 workers × prefetch) · Done: 0
Consumers should be idempotent. Exactly-once delivery is not something a broker can magically guarantee end-to-end; failures can happen after work completes but before the ack lands. Treat at-least-once delivery as normal, then enforce exactly-once effects in application logic with dedupe keys, outbox patterns, and state checks. Record a stable task id when side effects complete, then skip if it has been processed before.
Enqueue a batch, then Auto-run. About 95% of jobs ack cleanly; about 5% are poison, and they nack until they hit DLQ. Retries go to the head of the queue.
Toy rules assume up to 3 parallel in-flight slots; each enqueue flips a ~5% poison flag. Poison jobs take one nack per step until 3 nacks then DLQ; healthy jobs ack on that step. Poison retries use head-of-line priority.
Postgres-as-a-queue (SELECT … FOR UPDATE SKIP LOCKED) is a solid option well past “demo” scale.
Postgres can carry serious throughput if you operate it well. I have seen teams stay comfortable on the order of
100k events per second before a dedicated broker is even on
the table. The catch is discipline: the queue table is one of your hottest writers, so dead tuples accumulate fast. Tune
autovacuum aggressively and prune finished rows on a tight schedule, or bloat catches up and surfaces as long stalls and
random-looking crashes under load.
Autoscaling with queue depth
KEDA-style scaling on queue depth is the straightforward mental model. Backlog grows, replicas add, backlog falls, replicas trim. Make scale-down lazier than scale-up. When depth spikes, users are waiting, so add capacity immediately. When the queue drains, don’t rip capacity away instantly or you’ll thrash on the next wiggle. A short stabilization window before scale-down is cheap insurance.
Once you write down the guardrails, the math gets boring in a good way. If you target fifty pending messages per replica, cap replicas at a hundred, and each worker prefetches ten jobs, your worst-case in-flight work is on the order of replicas × prefetch, or a thousand concurrent agent executions in that toy example, bounded by the pools and rate limits you sized upstream.
Toy rules assume 10 workload units (pending + in-flight) map to 1 replica, min 1 / max 24. Each replica runs one job per step; a step finishes every active job, then refills from the queue up to replica capacity.
Observability: traces, logs, and metrics
Async fan-out turns “grep three surfaces” into the default debugging path. OpenTelemetry is the usual answer — traces, metrics, and logs as one model, emitted from ingress through workers and LLM clients with context propagated end-to-end. Reuse the same trace IDs in your structured logs so a user-visible timeout collapses to one worker line. Keep metrics RED-style on hot paths plus queue depth, pools, breaker state, and provider 429s. The LGTM stack (Loki + Tempo + Grafana) gives you LogQL and TraceQL out of the box. If you run LangGraph, LangSmith adds a nice graph-native trace and eval UI on top, which we use alot to traceback failures and different error types.
Start with structured logs, request IDs, basic metrics, and traces. That baseline is cheap enough to add early and saves painful guessing once work fans out across APIs, queues, workers, and LLM calls. Add tenant, cost, and cardinality controls when noisy neighbors, bills, or telemetry volume become real problems. The goal is enough signal to answer “what broke and why,” not instrumentation on every line.
Putting it together
The shape that keeps showing up starts with an API that accepts work (sometimes shedding load). A queue decouples submission from execution, workers scale with backlog and respect prefetch as a global throttle, HTTP clients are pooled and defensive, traces and logs carry shared context end-to-end, Postgres holds state behind PgBouncer with replicas or partitions when needed, and extra infra only appears when measurements demand it.
Each layer targets a different failure mode.
- Structured logs and traces tied to the same request IDs
- Pooling (HTTP + DB) fights connection exhaustion
- Breakers and classified retries stop cascades and thundering herds
- Prefetch caps runaway concurrency
- DLQs keep poison work from infinite loops
- Partitioning keeps retention from becoming a vacuum crisis
- Autoscaling matches spend and capacity to real queue pressure
In my experience, reliable stacks rarely win on the cleverest prompts alone. They treat the system around the LLM calls like any other production surface. Start from the Postgres deployment you actually tune. Understand your event loop. Harden your HTTP clients and circuit breakers. Propagate trace context through workers and provider calls. Pool everything that can be pooled. Add Redis only when measurement forces the issue. Put a queue in front of heavy work. Let autoscalers react to depth instead of vibes.
If you are building this kind of system, the lesson stays simple. The model is the interesting part, but the infra is what decides whether users get an answer or a timeout.
Further reading
- Postgres queue: keeping a Postgres queue healthy
- MVCC: MVCC in-depth explanation and how does it affect Postgres's health
- Utilizing Pg's memory: high memory usage in Postgres is good, actually
- PgBouncer: scaling Postgres connections with PgBouncer
- Messaging design patterns: pub/sub, queues, streams
- OpenTelemetry docs: OpenTelemetry